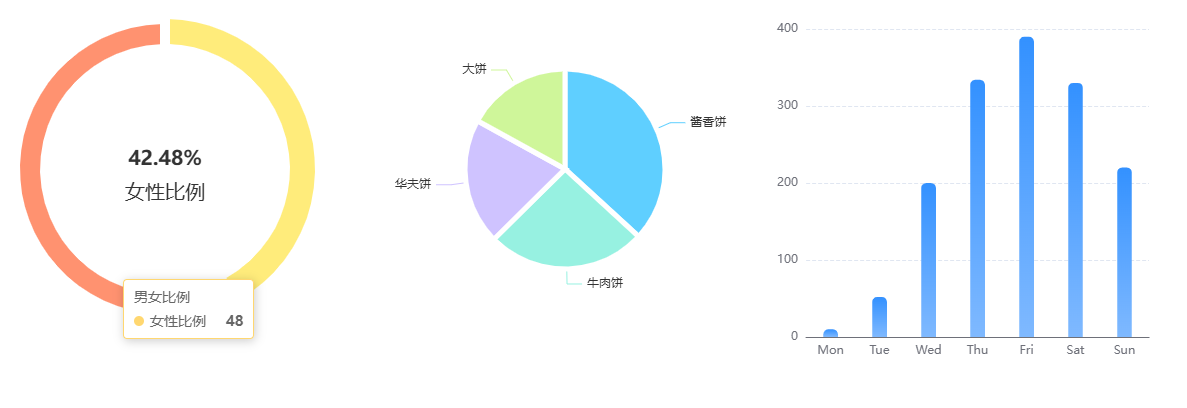
文章讨论了在需要定制化图表样式时,如何通过引入echarts.js并参考其配置文档进行美化调试。作者分享了自己在业务需求中遇到的定制化图表样式开发经验,并提供了环形图、柱状图和扇形图的配置代码示例。文章强调,面对复杂的图表需求时,需要查看官方配置文档进行调试。
此内容根据文章生成,不代表个人观点,仅用于文章内容的解释与总结
说到图表,那么echarts肯定是耳熟能详的,就算一些成熟的图形化组件,里面或多或少也能看到echarts的影子,或者说是基于echarts做的二次封装。
在做框架类项目时,我们直接引入一些开源的成熟图表直接无脑调用即可,但是如果是一些定制化图表呢?毕竟,人家的图表组件样式和UI出的图表样式可不一定相同。这个时候,你就无法避免的通过引入echarts.js,乖乖的去看它的配置文档进行美化调试。几千个配置项啊!谁看的过来?你能吗?
有时候你不逼自己一把怎么知道自己不行呢?
图表用的比较多的就是环形图,扇形图,柱状。而我恰好业务需求中遇到了定制化的图表样式开发,索性不是很难,起码不是要求是五彩斑斓的黑,呈现效果如下:

如果遇到类似样式的可以参考,代码如下:
echarts.html
<!DOCTYPE html>
<html style="height: 100%">
<head>
    <meta charset="utf-8">
    <title>ECharts 示例</title>
    <!-- 引入 ECharts 文件 -->
    <script src="https://cdn.bootcdn.net/ajax/libs/echarts/5.0.2/echarts.min.js"></script>
</head>
<body style="display:flex;height: 100%; margin: 0">
    <div id="pie" style="height: 400px;width:400px"></div>
    <div id="bar" style="height: 400px;width:400px"></div>
    <div id="pie2" style="height: 400px;width:400px"></div>
    <script type="text/javascript">
        console.log(echarts)
        // 基于准备好的dom,初始化echarts实例
        var pie = echarts.init(document.getElementById('pie'));
        var bar = echarts.init(document.getElementById('bar'));
        var pie2 = echarts.init(document.getElementById('pie2'));
        // 环形图
        var option1 = {
            tooltip: {
                trigger: 'item'
            },
            legend: {
                show:false,
                top: '5%',
                left: 'center'
            },
            series: [
                {
                name: '男女比例',
                type: 'pie',
                radius: ['60%', '75%'],
                avoidLabelOverlap: false,
                itemStyle: {
                    borderRadius: 3,
                    borderColor: '#fff',
                    borderWidth: 10 // 控制环形的厚度
                },
                label: {
                    show: false,
                    position: 'center',
                    formatter: function (params) {
                    return `{d|${params.percent}}%\n{b|${params.name}}`;
                    },
                    rich: {
                    d: {
                        fontSize: 20,
                        lineHeight: 50,
                        fontWeight: 'bold'
                    },
                    b: {
                        fontSize: 20,
                        lineHeight: 18
                    }
                    }
                },
                emphasis: {
                    label: {
                    show: true,
                    fontSize: 20,
                    fontWeight: 'bold'
                    }
                },
                labelLine: {
                    show: false
                },
                data: [
                    { value: 48, name: '女性比例' ,itemStyle: {color: '#FFD770'}},
                    { value: 65, name: '男性比例' ,itemStyle: {color: '#FF9270'}},
                ]
                }
            ]
        };
        // 柱状图
        var option2 = {
            title: {
                show:false,
                text: 'Referer of a Website',
                subtext: 'Fake Data',
                left: 'center'
            },
            tooltip: {
                trigger: 'item',
                formatter:'{d}%'
            },
            legend: {
                show:false,
                orient: 'vertical',
                left: 'left'
            },
            series: [
                {
                name: 'Access From',
                type: 'pie',
                radius: '50%',
                data: [
                    { value: 1048, name: '酱香饼',itemStyle: {color: '#5FCFFF'} },
                    { value: 735, name: '牛肉饼',itemStyle: {color: '#97F1E1'} },
                    { value: 580, name: '华夫饼',itemStyle: {color: '#CFC3FF'} },
                    { value: 484, name: '大饼',itemStyle: {color: '#CFF69A'} },
                ],
                itemStyle: {
                    borderRadius: 1,
                    borderColor: '#fff',
                    borderWidth: 5
                },
                emphasis: {
                    itemStyle: {
                    shadowBlur: 10,
                    shadowOffsetX: 0,
                    shadowColor: 'rgba(0, 0, 0, 0.5)'
                    }
                }
                }
            ]
        };
        //扇形图
        var option3 =  {
            tooltip: {
                trigger: 'axis',
                axisPointer: {
                type: 'shadow'
                }
            },
            grid: {
                left: '3%',
                right: '4%',
                bottom: '3%',
                containLabel: true
            },
            xAxis: [
                {
                type: 'category',
                data: ['Mon', 'Tue', 'Wed', 'Thu', 'Fri', 'Sat', 'Sun'],
                axisTick: {
                    show: false
                }
                }
            ],
            yAxis: [
                {
                type: 'value',
                splitLine:{
                    lineStyle:{
                    type:'dashed'
                    }
                },
                }
            ],
            series: [
                {
                name: 'Direct',
                type: 'bar',
                barWidth: '30%',
                data: [10, 52, 200, 334, 390, 330, 220],
                itemStyle: {
                color: new echarts.graphic.LinearGradient(0, 0, 0, 1, [
                    { offset: 0, color: '#3391FF' },   // 渐变色起始颜色
                    { offset: 1, color: '#7FB9FF' }    // 渐变色结束颜色
                ]),
                barBorderRadius: [5, 5, 0, 0]  // 设置圆柱的圆角,分别为左上、右上、右下、左下
                }
                }
            ]
            };

            // 使用刚指定的配置项和数据显示图表。
        pie.setOption(option1);
        bar.setOption(option2);
        pie2.setOption(option3);
    </script>
</body>
</html>
如果遇到更复杂的,那就只有去看官方配置文档调试了。